python畫圖模組Matplotlib簡介系列#1-- 基本畫圖功能示範
·
Sean Sie
安裝
請先用 pip 安裝必要的套件 numpy (python中一個很重要的套件,專門處理高維陣列的),與今天的主角 matplotlib 。
pip install numpy
pip install matplotlib
安裝完後可以在 終端機下指令驗證,方法如下。
pip show matplotlib
pip show numpy
如果成功安裝會出現該模組的相關訊息。
截錄一下
Name: matplotlib
Version: 3.9.1
Summary: Python plotting package
Home-page: <https://matplotlib.org>
Author: John D. Hunter, Michael Droettboom
Author-email: Unknown <matplotlib-users@python.org>
License: License agreement for matplotlib versions 1.3.0 and later
        =========================================================

        1. This LICENSE AGREEMENT is between the Matplotlib Development Team
        ("MDT"), and the Individual or Organization ("Licensee") accessing and
        otherwise using matplotlib software in source or binary form and its
        associated documentation.
如果沒有成功安裝會出現以下字樣,我以 pip show thepacknotexist 爲例子。
WARNING: Package(s) not found: thepacknotexist
基本用法
在開始畫圖之前,首先要先有資料,不過這個套件是依賴於 numpy 這個套件的陣列功能的,所以這裏我來爲大家示範一下如何在numpy中建立一個陣列,表示x座標的資料
x=np.array([1, 2, 3, 4 ,5])
也就是用 np.array 函數創造一個陣列( <class 'numpy.ndarray'> )物件,裏面的元素需用方括號包裹起來且用逗點區隔,並指定給變數 x
接著來用 y 座標的
y=np.array([5 ,4 ,3, 2,1])
準備好這兩個資料之後,要開始畫圖了,用 plt.plot() 來建立一個圖表
plt.plot(x,y)
其中引數格式如下 plt.plot()**(x-axis, y-axis,style code)**
- x-axis:x軸資料
- y-axis:y軸資料
- style-code:進階樣式設定,例如線條的顏色等等,可以參見以下連結
https://matplotlib.org/stable/api/_as_gen/matplotlib.pyplot.plot.html
最後用plt.show函數展示
效果如下
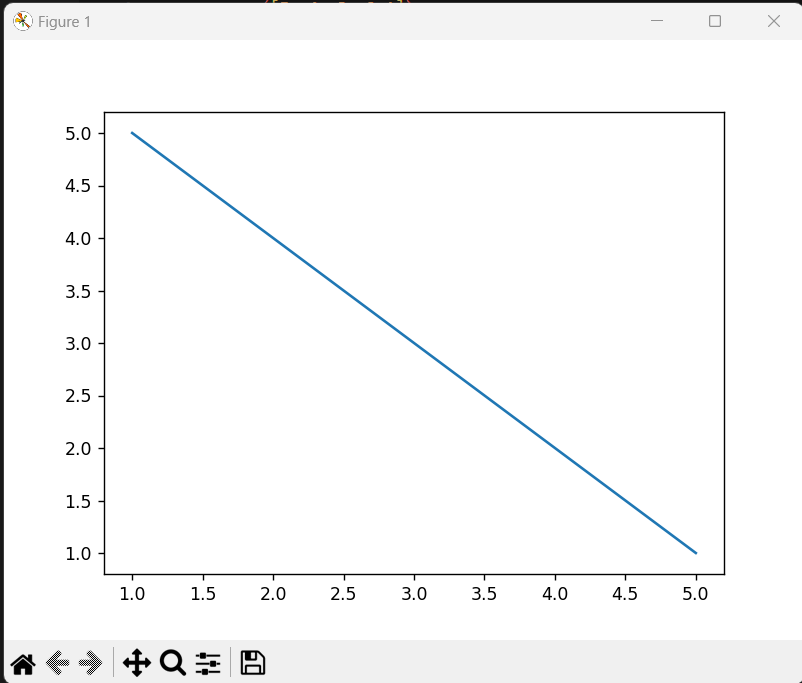
總程式碼
import matplotlib.pyplot as plt
import numpy as np
x=np.array([1, 2, 3,4,5])
y=np.array([5 ,4 ,3, 2,1])
plt.plot(x,y)
plt.show()